Passive DNS monitoring with dnsmasq, rsyslog and Splunk
There's not too many articles about this out on the internet, so I thought I'd give it a go. Configuration is based on a Raspberry Pi running Raspbian (Jessie) and Splunk 6.2.4.What is passive DNS monitoring?
It's the practice of recording DNS query replies on your network. It's a small bit of information which can help diagnose network issues, and of course identify potentially compromised hosts through either overt detection (think: x837fnv9ebfj38390nf78d7.evil-domain.ru) or baseline anomalies.About the tools
-
dnsmasq – a home network's best friend – caching DNS,
DHCP & tftp server
-
rsyslog – a system logging daemon with powerful features. Default syslogd in Debian.
-
splunk – commercial log analysis platform, free for up to
500Mb/day intake
dnsmasq setup
Just enable the log-queries option to your existing setup and you're good to go.
$ echo "log-queries" > /etc/dnsmasq.d/log-queries
$ service dnsmasq restart
rsyslog setup
Observe that dnsmasq logs DNS queries now into /var/log/daemon.log. The two lines we're most interested in contain the texts "query" and "reply", so lets snarf them in rsyslog. We'll add a little context to keep it real.$ cat /etc/rsyslog.d/00-dnsmasq-splunk.conf
if $programname == 'dnsmasq' and ($msg contains ' query[' or $msg contains ' reply ') then @splunkserver:5141
splunk setup
We'll be doing multiple things in Splunk, so lets take it one step at a time.intake
Splunk now has to have a syslog listener on port 5141. Navigate to Settings -> Data Inputs and add a new UDP listener. (you could also go TCP, use @@splunkserver:5141 in rsyslog, and shake hands all around). You'll accept messages from raspberrypi (restrict to host) and set the source type to linux_messages_syslog. As per best practice log it into its own index (e.g. 'dns') with a source name override of 'dns' too.You can pull up the search app now and test that you're seeing events matching e.g. "index=dns" &/or "source=dns"
Field Extractions
There's four main important data elements in the dnsmasq logs:- dns_query_clientip - ^.+query\[.+\s(?P
.+)$ - dns_query_hostname - ^(?:[^\]\n]*\]){2}\s+(?P
[^ ]+) - dns_reply_hostname - ^[^\]\n]*\]:\s+\w+\s+(?P
[^ ]+) - dns_reply_ip - ^.+reply.+\s(?P
.+)$
You can easily make these in Splunk 6.2.4 by clicking on "Extract New Fields" in the field list on the left side. You can cut/paste the above regexps in by choosing "I prefer to write the regular expression myself", or have fun like I did by poking around with the mouse then fixing it up later.
Data model
To make things easier, we can create a data model for the DNS information which automagically extracts the fields we like. You'll probably like the date information and the four fields we created above.dashboard
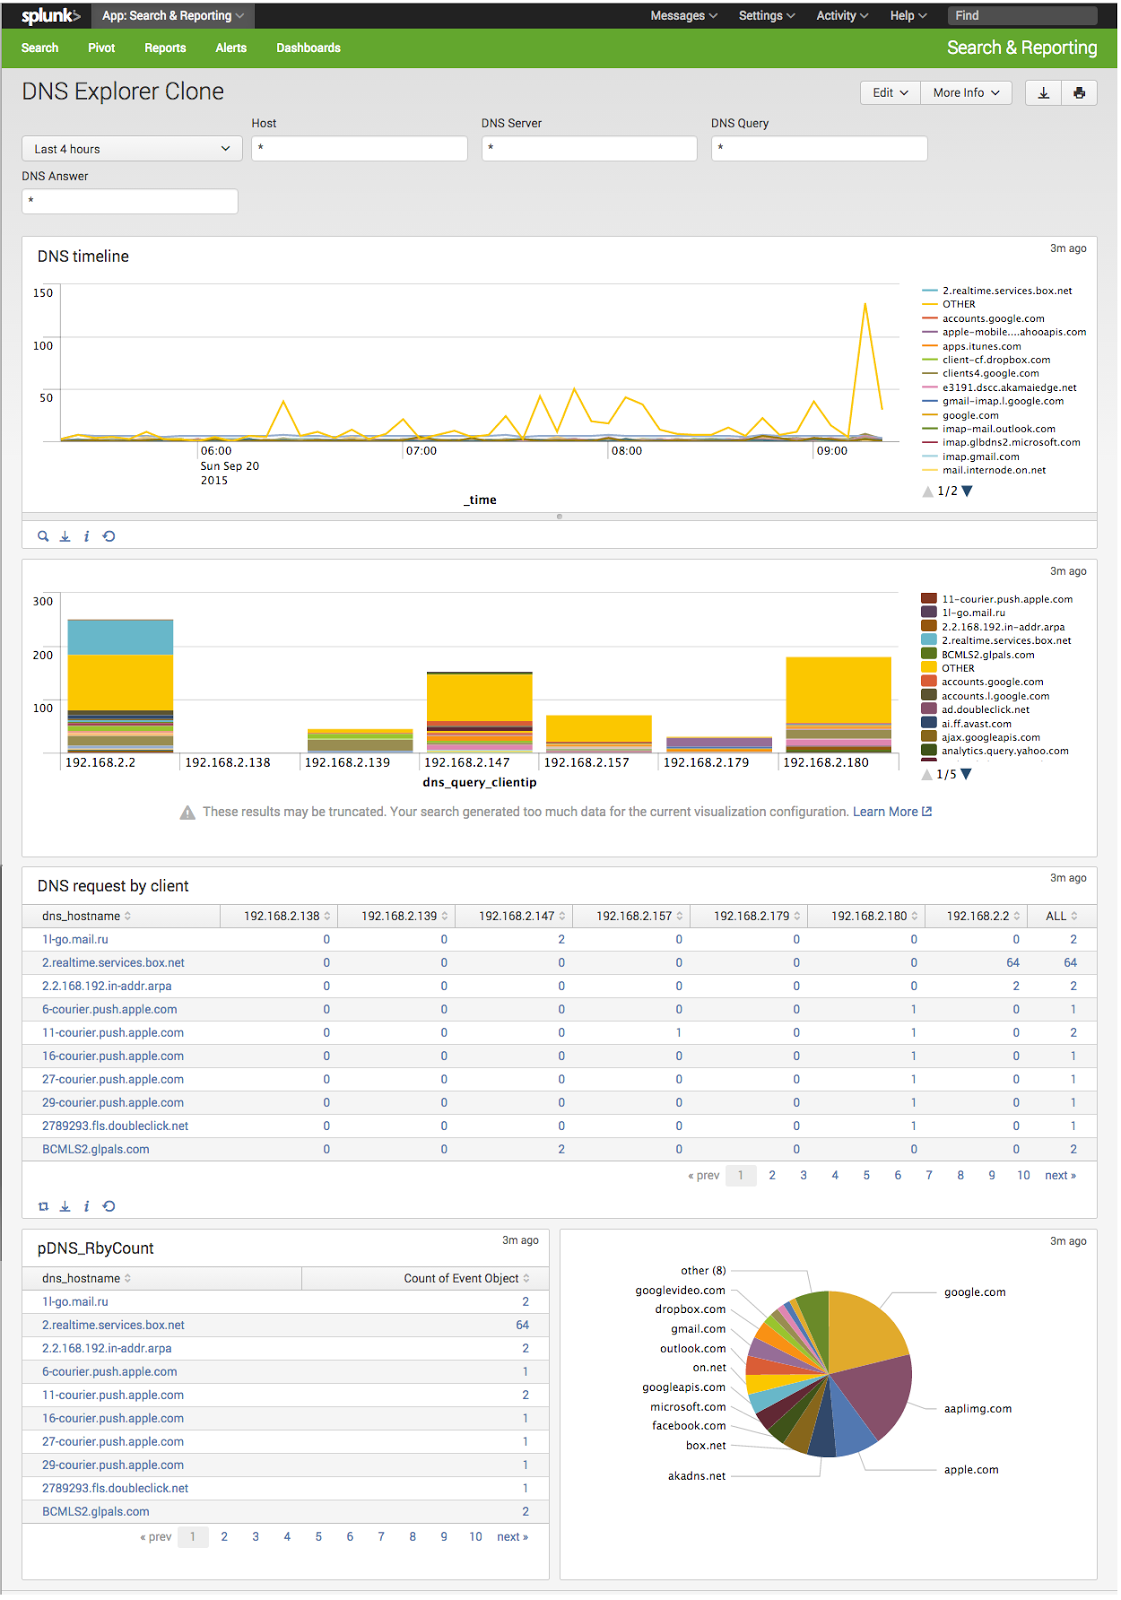
You can now create a custom dashboard to let you easily interrogate DNS traffic. Start with a Pivot on the data model, and play around with the stats and charting as you wish. Edit panels and add inputs for the time and the extracted data fields. Create some visualisations.Interesting info for analysis:
- TLD. Create a search macro dns_tld defined as: index=dns | rex field=dns_hostname "(?P
[A-Za-z0-9]+\.[A-Za-z]+)$" | transaction dns_hostname startswith="query" - Top queried domains. Try: `dns_tld` | top 25 domain
- Anomalies. Try: `dns_tld`| anomalies field=dns_hostname | sort - unexpectedness
No comments:
Post a Comment